

Table of Contents
For thousands of years, people have tried to interpret signs in an attempt to know what the future holds. Stargazing and reading palms, tarot cards and tea leaves are just some of the methods used.
Such attempts are now considered superstitious by many. However, some investors believe that certain signals can accurately predict how stocks will perform. And there are two key indicators flashing right now that could indicate a big move in the stock market.
The ‘fear index’ is rising
Franklin D. Roosevelt famously said, “The only thing we have to fear is fear itself.” If so, investors may have something to fear. Why? The stock market’s ‘fear index’ is rising.
I refer to the CBOE Volatility Index (VOLATILITY INDICES: ^VIX), which is also commonly known by the ticker symbol VIX. Over the past month, the VIX has risen more than 30%.
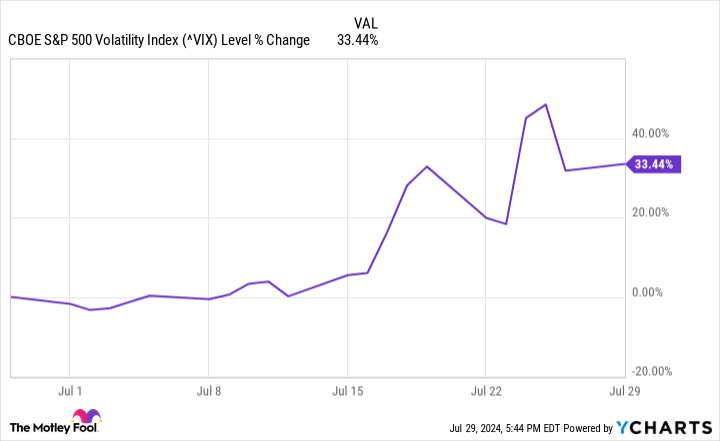
This index measures the expectation of volatility in the S&P500 for the next 30 days. It is calculated based on the prices of the S&P 500 index options. The higher the prices of these options, the more volatility is expected.
The stock market is largely determined by the mindset of investors. When investors have confidence, they are more likely to buy stocks. This creates buying pressure that pushes stock prices higher. However, when investors are afraid, they are more likely to stay on the sidelines. This could form the basis for a decline in stock prices.
The Buffett indicator is almost at a record high
More than twenty years ago, Warren Buffett described… Fortune magazine which he considered “probably the best measure of the state of valuations at any given time.” He was talking about the ratio of the total U.S. stock market value to the country’s gross domestic product (GDP). This ratio became known as the Buffett indicator.
When Buffett made this statement in December 2001, the stock market was in the midst of a major sell-off as the Internet bubble burst. The legendary investor argued that when the ratio of total stock market value to GDP rose to unprecedented levels two years earlier, it “should have been a very strong warning sign.”
Buffett also said in the Fortune article, “When the ratio approaches 200% – as it did in 1999 and part of 2000 – you are playing with fire.” He mentioned that the ratio had recently reached 133%.
Fast forward to the present. The Buffett indicator is at almost 194%. The only time it was higher was in November 2021. The S&P 500 quickly began a sharp decline, eventually falling more than 19%.
Is a big price drop coming?
With two indicators flashing ominously, is a big stock market drop coming? Maybe, but not necessarily. No stock market indicator is perfect.
For example, the CBOE Volatility Index was much higher at the beginning of 2023 than it is now. The S&P 500 ended the year up 24%.
As for the Buffett indicator, even as the ratio reached an all-time high in early 2018, the S&P 500 continued to rise. It’s also important to note that the ratio only uses U.S. GDP, but many U.S. companies generate a large portion of their sales in other countries. Globalization has made the Buffett indicator less useful than it once was.
What should investors do? I think they should only buy stocks that are attractively valued relative to their growth prospects. I also believe that it is a good idea to have some money on hand to put in if the stock market falls. However, I would recommend these two things even if the ‘fear index’ was down and the Buffett indicator was much lower.
Don’t miss this second chance at a potentially lucrative opportunity
Have you ever felt like you missed the boat on buying the most successful stocks? Then you would like to hear this.
On rare occasions, our expert team of analysts provides a “Double Down” Stocks recommendation for companies they think are about to pop. If you’re worried that you’ve already missed your chance to invest, now is the best time to buy before it’s too late. And the numbers speak for themselves:
-
Amazon: If you had invested $1,000 when we doubled in 2010, you would have $20,633!*
-
Apple: If you had invested $1,000 when we doubled in 2008, you would have $41,238!*
-
Netflix: If you had invested $1,000 when we doubled in 2004, you would have $338,114!*
We’re currently issuing ‘Double Down’ warnings for three incredible companies, and another opportunity like this may not happen anytime soon.
*Stock Advisor returns July 29, 2024
Keith Speights has no position in any of the stocks mentioned. The Motley Fool has no position in any of the stocks mentioned. The Motley Fool has one disclosure policy.
Two key indicators are flashing that could indicate a big move in the stock market was originally published by The Motley Fool